
Visualization of Complex Ideas
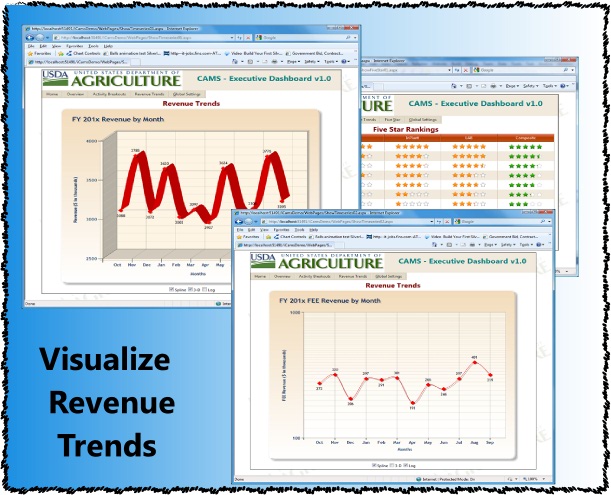 For over 20 years we have focused on helping users "see" their data. Visualizing underlying trends by interpolating
and extrapolating is just one example of what we mean.
For over 20 years we have focused on helping users "see" their data. Visualizing underlying trends by interpolating
and extrapolating is just one example of what we mean.
Sometimes converting from a linear to a log scale reveals otherwise hidden information.
We have accumulated many tools and techniques to accomplish the goal of making voluminous data easily understandable. Regardless
of which technologies are being used, the art of making sense out of a mountain of data is what remains most important.
It's what we do best!