
Adding Smart Graphics to your Applications
 One of our areas
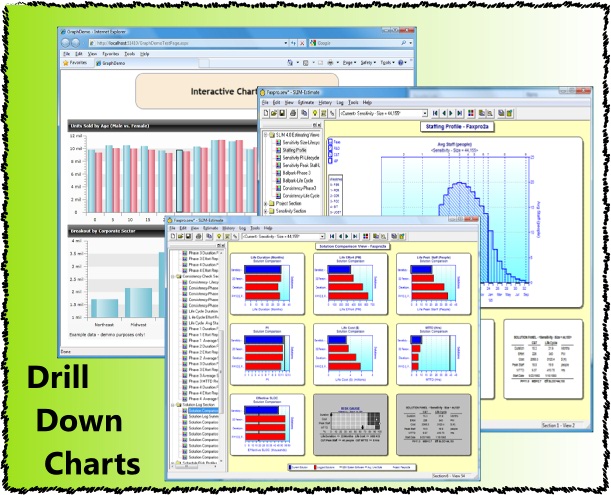
of expertise is adding interactive graphics to an application. All of these graphs are dynamic objects
in that as you click on an area additional information reveals itself. This "drill down" concept in used in many
executive dashboards as well.
One of our areas
of expertise is adding interactive graphics to an application. All of these graphs are dynamic objects
in that as you click on an area additional information reveals itself. This "drill down" concept in used in many
executive dashboards as well.
Sometimes there is no better way to visualize the underlying relationships in your data than
by allowing the user to explore the data and literally see how it behaves under different what-if scenarios.
These are actual screen snaps from commercial apps we have built and prototypes we have developed
for clients.